Data & Reporting
Insights to Power Your Digital Campus
Access a wealth of behavioral data mined from user engagement to paint a picture of what makes a successful student outside the classroom.

Reporting Views
3 Great Ways to Get Information
Pathify presents platform-wide data and reporting in three categories so you easily get the information you need.
Pathify Admin Center
Monitor social activity, keywords and user behavior through real-time dashboards. Access raw data for deep dives or use high-level insights to optimize how the community experiences technology.
Canned Reports
Want quick, visually appealing insights about the most important metrics? Pathify offers 18 pre-built reports accessed via Data Studio.
Web Analytics
Being a web based platform enables admins to dive deep — like, really deep — into user actions, habits, flows, devices and more.
In-Hub Reporting
Admin Center Reporting
View Campus Experience Hub analytics via Admin Center reporting dashboards. System admins get access to metrics for five of the most commonly requested data channels — viewed in platform or downloaded as a CSV.

Overview
See an overview of all reporting areas for all time or by defined date range.
Social
Get a graphical view of social interactions like posts, likes and comments.
Keywords
See how often top keywords appear over a certain period of time.
Users
Understand your user base by looking at all active users, active users within certain date ranges, users by role and more.
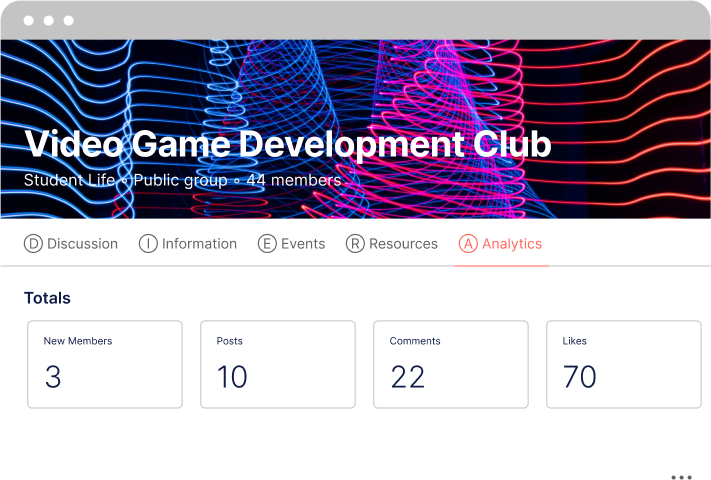
Groups
Understand how groups are doing by looking into member numbers, posts, shortcuts created and events.
Detailed Views
Canned Reports
Pathify delivers 18 highly graphical and detailed reports through the Data Studio. Data Studio reporting surfaces detailed information like total page views vs. unique page views, desktop vs. mobile usage and even Android vs. iOS usage.
Web Analytics
This Data Runs Deep
For total data nerds, Pathify connects each institution’s portal to Web Analytics, providing access to a deep well of data delivering unique insights. Including everything from user flow to what individual model smartphones your students use, Web Analytics drills down to see who uses the platform, how they’re accessing it and what they’re doing.
Set specific date ranges and view data by day, week or month breakdowns. Save your favorite Web Analytics reports to revisit later or export data to share with key stakeholders.

Ad Hoc Reporting
Get Personalized Reports
Need reporting outside what’s preconfigured? Let us know, we’re happy to help scope and create custom reporting for your institution.
Examples of custom reporting:
Group Admin Reporting
Give Group Admins More Control
Seeing key engagement metrics as a Group administrator is critical. Group admins access a special “Analytics” tab for the groups they manage for key insights into group activity and engagement.