

Around 2006, I was working for the LMS company, eCollege. The platform (which would eventually be purchased by Pearson and turned into Learning Studio) was very much on the front edge of statistical analysis for learning, based on a sea of new data availability.
In those early days, my team and I were partly responsible for asking new behavioral, monitoring, or trending type data questions, performing the analysis, and then promoting the answer, as well as ancillary actions that might be considered an effective practice.
For example, as the platform for 17 of the top 20 largest, fully online colleges and universities in the country (back then), we had access to hundreds of thousands of students records. One of the research questions we asked (and answered) was around first week signals of risk or success. The most risky behavior for students to engage in? Emailing their professors. The more emails a professor received in the first 10 days of class, the more drops they saw. Likewise, the more a single student emailed a professor in the first 10 days of class, the more likely they were to drop that class.
Upon further examination, the (huge) majority of those emails contained questions from students. The questions were not typically improper or “out of left field” but instead were questions about process, directions, requirements, etc. In other words, the information was not easily find-able, readily available, or in some cases existent in those early online courses. So students emailed. This resulted in suggestions from my training team for a Virtual Office (where the same question could be asked and answered one time instead of twenty as well as a spot where crowd sourced answers could be given). This resulted in recommended changes to syllabi. This resulted in more commitment to redundancy of information, ensuring it was placed in meaningful spots throughout the courses. Etc.
We likely added to the online education recommendations literature a great deal, using the first semblance of data to help illuminate best practices.
Yet I sit here more than a decade later fully cognizant that some of that data and some of those findings were flawed, not because the numbers were wrong, but because of assumption, variability, and more.
For example, back then we often started with a bad premise for online learning. That premise was eLearning should “mirror” or translate face-to-face learning as much as possible. How foolish! With a world of different connection points, different capabilities, and different mediums converging, why was it important to replicate what is often a poor model of education? Most of my blogs from the past decade point to study after study illustrating the misgivings and lack of efficacy with lecture, yet we know that most professors still lecture most of the time. Why copy that bad practice, even watering it down via a different channel? And on top of that question, why study data about a copy of a model, not even the model itself?
(I firmly believe this is why “Student Success” systems see such a small uptick in retention numbers, but that is likely another blog entirely…)
Today’s Data
With all of that context, I still love to leverage data, asking questions about monitoring, trending, behaviors, skills, and more. As most of us learned, and hopefully as the previous introduction stated, we have to be as ‘smart’ as possible regarding that data. But at the same time, we should not ignore it, waiting for it to be perfect. Perfection will never, ever happen.
 So here is an example of some data that higher education should probably take note of. At first you may wonder why I’m pulling from these (seemingly) disparate sources, but I think if you stick with me, you’ll see how it plays out. Of course, I would hope we could replicate some of the research behind the numbers you are about to see, although I also know that most studies are never, ever replicated (which is truly troubling).
Let me start with Educause and their library of research, including ECAR findings. They have performed a lot of research in and around education technology for a lot of years and their assistance in this undertaking is important. Why? Because they are about as close to an unbiased source as you will find. Whether pure perception or legitimate reality, studies perpetuated by a company or a consortia or even a consulting group are often suspect. In the (email) example above, I heard more than once that we were somehow trying to encourage use of our platform over others, because of how we leveraged email. While it was not true, I see why it was questioned. But Educause performs a lot of research that is cleaner than most, as it does not necessarily (inherently) provide bias. Here are some examples from the 2018 student technology almanac:
- Only 4% of higher education students own 0 or 1 Internet capable device, seeing 96% with 2 or more devices. (In fact, 40% own 4 or more such devices.)
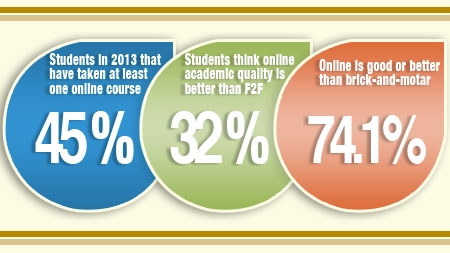
- 38% of students prefer face-to-face classes only, with the rest desiring hybrid or fully online classes.
- While 60% spend at least 3 hours of their daily lives using technology for research and homework, the other 40% spend that same amount of time on social media, streaming videos, and more.
- More than 3/4 have access to wifi anywhere on campus with almost the same number having access off campus.
But here is where things start to get more nuanced. As well, here is where some ‘systems thinking’ is important.
At one of my previous institutions, we did some research around students access to our portal, which led to all of their education technology. 55% of students visited the portal each week, with 45% only visiting one time per year. (Students had bookmarked whatever perceived technologies were important, and bypassed the portal altogether, meaning they would not see announcements, alerts, new tools added, etc.)
So where do students spend their time online? Are they clicking into our eLearning tools, our school administration systems, or our community platforms? According to a Schweiki Media and Study Breaks College Media survey of college students, they are spending more time online socially than working. 95% of students report at least some form of social media usage, including the basics such as posting, liking, and commenting, but also including purchasing, researching people, and receiving news. Students spend the largest chunk of time on social media in the evening, but see usage throughout the day. And 75% use a smartphone for social media “checking” versus a laptop or desktop.
Here is another statistic from a university where I worked. After using a Student Success platform to identify students who were at risk of dropping out, we saved less than 10% of those we contacted (which was the equivalent of a 1/2% in total retention). Why? There is no single answer of course, but as most of you in the student success business know, once a student’s grades dip, it’s too late to save them. However, when utilizing new data from a source not necessarily associated with learning, that number jumped dramatically.
So What?
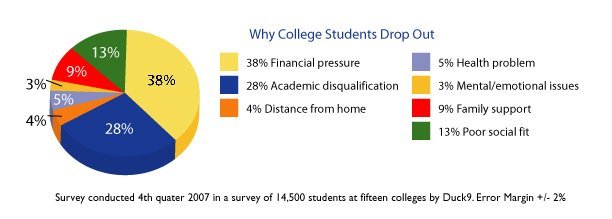
Ok, so by now, you may be wondering just what kind of rabbit hole I’ve sent you down. Who cares about the social media habits of college students, right? Let me give you one more statistic that will start to bring everything we have looked at together, like an M. Night Shyamaalan movie. While the numbers do fluctuate, I have never seen a study suggesting students leave school less than 50% of the time, for reasons that are not academic.
 |
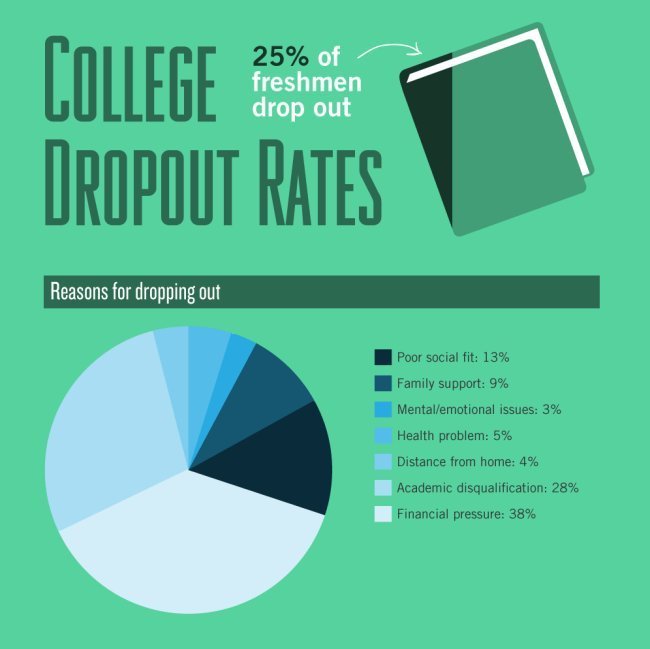 |
So, when looking at where college students spend their time (and where they don’t), how important devices and social media are, while seeing how many students leave because they are lonely, unsupported, and have other, “non-cognitive” issues, I hope it starts to make more sense.
Student success has almost always looked at how the classroom experience can improve. Retention specialists take aim at faculty empathy, LMS engagement, homework, and other stressors caused by academic pursuit. Yet, without the ability to control much of the academic equation (such as preventing lecturing from happening) and without much ability to control the outcome (via an accountable review process), when added to the notion that academics isn’t even the problem for at least half of the dropout population, there is no wonder so little effect occurs when placing all of the effort in academics.
It feels so familiar…looking for markers that just do not matter. So, when we read that Blackboard has done a study of more than 600,000 students suggesting the single best predictor of academic success is a student who checks the gradebook often, I have to wonder if we are even asking the right questions? Or when some research shows that logging out of the LMS is the best predictor of drops, what about all of the students who never logged into the LMS in the first place?
But, when I read IHE and find that a very small study has reinforced that the perception of a “caring” professor matters, it is not surprising. (It is also not surprising that they felt more could be done…this is likely because so much of the equation has gone untreated.) It also explains why thoughtful practitioners who are both concerned by and questioning the reasons for disengagement, without the aid of statistics, have come to the conclusion that community, socialness, and connectedness matter. They are right, of course. But they are only partially right. It goes beyond the classroom.
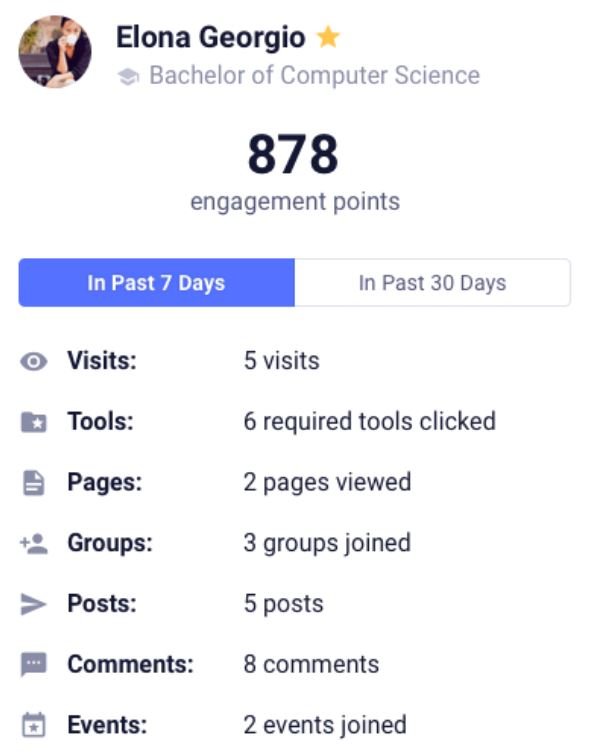 Ok, you likely already know that this was self-serving. Of course we use these numbers at Campus. They make our platform seem like a silver bullet, after all. But here is the deal. I used these kinds of statistics (and a lot more), specific to affective and conative support for the cognitive part of the learning triangle long before coming to Campus. It is why my university team and I chose and implemented Campus in the first place. It is also Campus that provided new kinds of data, allowing us to save students far earlier and at much higher numbers than our ‘Student Success’ platform.
It goes beyond community. It goes beyond connecting people to systems. It goes beyond content. It goes beyond helping communicate with students, faculty, and staff far better. It goes beyond the classroom. It even goes beyond all of these statistics.
Campus goes beyond the Portal.
Good luck and good learning.
(Want to read more? Check out this case study detailing how my old university used this system and this data to transform.)
